Three AI modules, each built for a specific nuclear medicine imaging challenge.
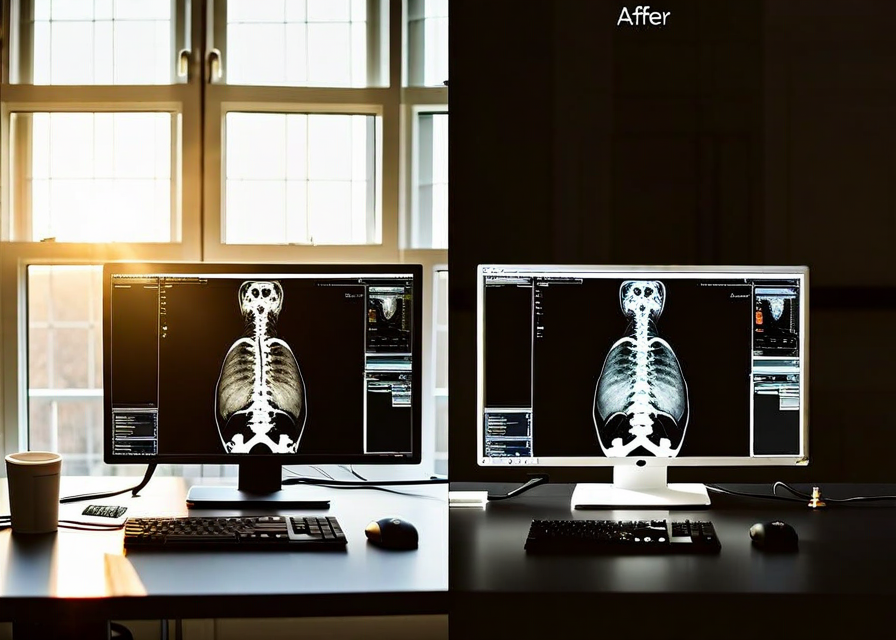
Standard nuclear medicine acquisitions use the minimum dose and acquisition time needed for diagnosis. That means noise - the gamma camera collects fewer photons than a CT scanner collects X-rays by several orders of magnitude. The result is granular, noisy images where small lesions can be obscured by statistical noise.
NucliVision's enhancement model is a convolutional neural network trained specifically on paired low-count and high-count nuclear medicine acquisitions. It learns what real signal looks like versus noise for each tracer type: FDG, DOTATATE, PSMA, sestamibi, and bone scan.
The output is enhanced images delivered as DICOM secondary captures back to the existing PACS. Physicians see both the original and the enhanced scan. No workflow change, no new viewer required.
Personalized radiopharmaceutical therapy requires dosimetry. The physics is well established - measure organ uptake at multiple time points, fit a kinetics curve, integrate under the curve to get absorbed dose. The clinical bottleneck is that this calculation, done manually, takes 60-90 minutes per patient and requires specialized medical physics support.
NucliVision automates the complete dosimetry workflow: organ segmentation from the SPECT/CT, S-value calculation using patient-specific anatomical data, time-activity curve fitting, and dose report generation in PDF format suitable for inclusion in the treatment planning note.
The system supports pre-treatment dosimetry for dose prescription and post-treatment dosimetry for outcome correlation. Both calculation modes follow EANM dosimetry committee guidelines.
A nuclear medicine report requires quantitative data: SUVmax, SUVmean, lesion volume, lesion-to-background ratio, PERCIST/RECIST response criteria, Deauville score for lymphoma. Extracting these numbers manually from a viewer and typing them into a report takes 15-25 minutes per scan. Across a 20-scan day, that is 5 hours of transcription work.
NucliVision extracts quantitative metrics automatically from the enhanced scan data and populates a structured report template. The physician opens a pre-populated report: findings section filled with measurements, comparison to prior study auto-generated, impression section templated with differential based on tracer and clinical indication.
The physician reviews, edits as needed, and signs. Total time from opening the viewer to dictating the impression typically drops from 25 minutes to 8 minutes per scan in our beta site data.
We run evaluations with live clinical data. Bring your own cases - PET, SPECT, or dosimetry series.
Request an Evaluation